
A shopper sees a display banner on the way to work, scrolls past a retargeted ad at lunch, watches a video pre-roll that evening, and buys the product the next morning. Four touchpoints, one purchase. The question that keeps marketers up at night is simple to ask and surprisingly hard to answer: which of those four moments actually deserves the credit?
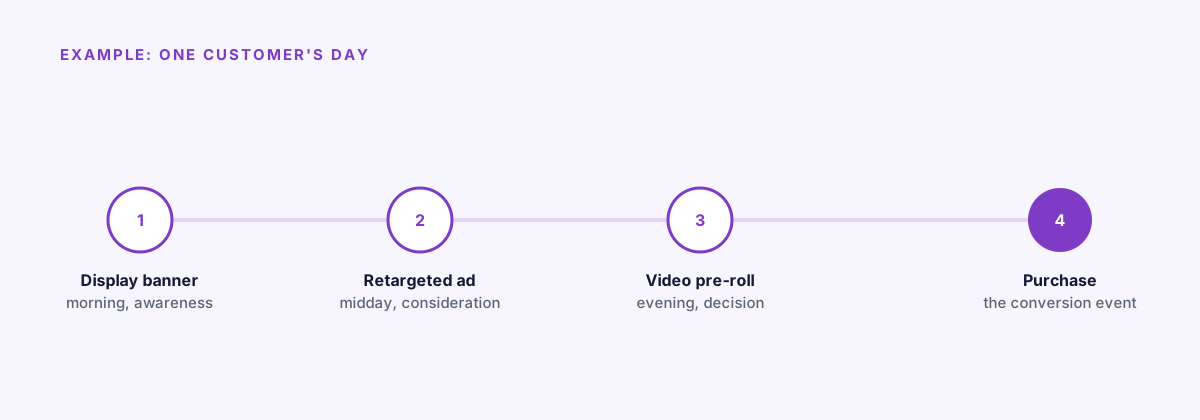
A single purchase, built from several touchpoints spread across one day. Attribution decides how the credit gets split between them.
Get the answer wrong and you reward the wrong channel, cut the budget that was quietly doing the early work, and draw conclusions from numbers that were never measuring what you thought they were. Programmatic attribution models exist to answer exactly this question, and the model you pick decides which channel gets the credit.
What are the main attribution models?
Last-click attribution is the most common answer, and the most criticized one. It hands 100% of the credit to whatever touchpoint happened right before the purchase, which is easy to implement but blind to everything that built interest earlier in the journey. First-click flips that logic entirely, crediting the very first touchpoint and ignoring everything that kept the prospect engaged afterward.
Linear attribution splits credit evenly across every touchpoint, trading the blind spots of single-touch models for a different flaw: treating a brand-building impression and a last-minute nudge as equally important, which they rarely are. Time-decay attribution leans the other way, giving more weight to touchpoints closer to the conversion, a reasonable assumption for short purchase cycles but one that can undersell early brand-building work.
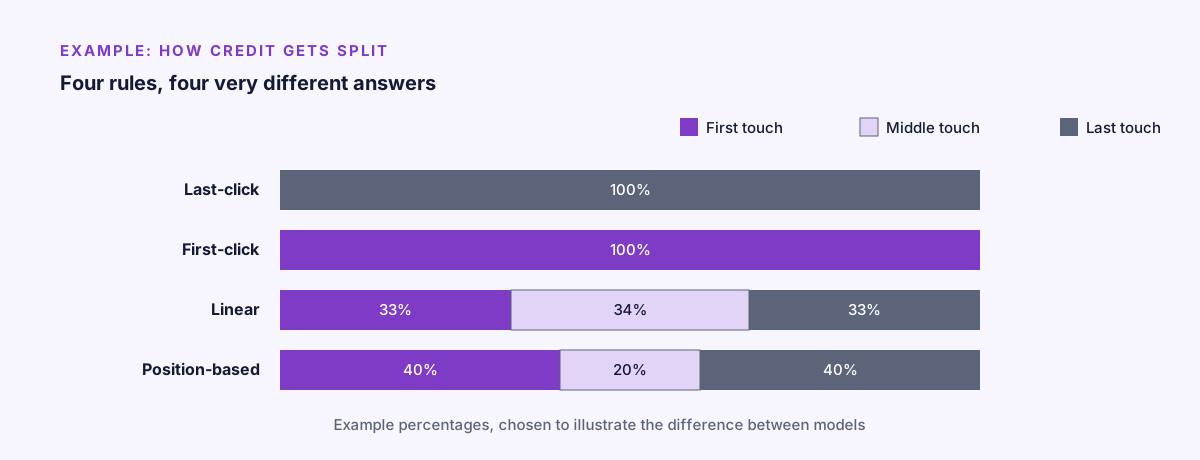
Example percentages, but the pattern is real: the same customer journey can produce four very different attribution results, just by changing the rule.
Position-based attribution tries to take the best of both worlds, typically weighting the first and last touch heavily (40% each, in a common example) and splitting the remainder across whatever happened in between, acknowledging that discovery and closing both matter. Data-driven attribution skips fixed rules altogether, using statistical models to weight each touchpoint based on patterns actually observed in conversion paths. It tends to be the most accurate option, but only once there is enough data flowing through it to trust.
Four models, the same four touchpoints, four different stories about what actually worked.
Why do offline and cross-channel campaigns complicate attribution?
Attribution gets harder once a campaign spans multiple channels (display, video, connected TV, digital out-of-home) and the goal is something that happens off a screen entirely. View-through attribution tries to credit an impression the user never clicked on, within a defined window after exposure. Foot traffic measurement takes a different angle, using mobile location data to correlate ad exposure with a later visit to a physical store, which matters a great deal when the desired outcome is someone walking through a door rather than completing a checkout online. Incrementality testing goes a step further still, running holdout experiments to measure the lift a campaign actually produced, independent of whatever any single attribution model claims.

The moment a customer checks a phone before stepping into a store is itself a touchpoint, and a hard one to attribute cleanly.
The traps that distort the numbers
Two problems show up again and again. The first is double-counting: when several platforms each claim credit for the same conversion using their own logic, often because each one only sees its own slice of the journey, the sum of reported conversions across tools can comfortably exceed the number of conversions that actually happened. Centralizing measurement through one ad server or one independent measurement partner is the usual fix.
The second is the attribution window itself, the length of time you look back to credit a touchpoint. A 7-day window and a 30-day window, run against the exact same campaign, can tell two noticeably different stories about what worked. Walled gardens add a further wrinkle, since large platforms generally report using their own attribution logic, which rarely reconciles cleanly with numbers from independent tools.
Whatever model you pick, the reporting underneath it needs to be trustworthy before the attribution logic on top of it means anything.
Choosing a model for local retail
Local retail rarely converts in an online checkout. The real conversion events tend to be store visits, phone calls, or local purchases that never touch an e-commerce flow, which makes offline measurement approaches worth taking seriously alongside standard digital attribution, especially once campaigns are built around real drive-time zones rather than a flat radius. Short purchase cycles, typical of local decisions, a weekend promotion, a one-day sale, a nearby competitor closing, often make time-decay models a reasonable default, since the touchpoint that mattered most is usually the one closest to the decision. Longer-consideration, brand-building campaigns, the kind built around awareness rather than an immediate offer, tend to fit a position-based or data-driven approach better, since the goal is to understand how discovery and closing worked together rather than reward only the final nudge.
FAQ
What is the best attribution model for a small budget?
There is no single best model. Time-decay is a reasonable default for short, local purchase cycles, since it is simple to set up and tends to match how people actually decide. A data-driven model only outperforms it once there is enough conversion volume to train on.
Does a platform’s default attribution count as data-driven?
Not automatically. Many platforms default to last-click or a simple rules-based model unless you specifically configure a statistical, data-driven option. Check the setting rather than assuming the label matches the behaviour.
How long should an attribution window be?
It depends on the purchase cycle. A local, impulse-driven purchase fits a short window of a few days, while a longer-consideration product can justify 30 days or more. Running the same campaign through two different windows is the fastest way to see how much the choice actually changes the picture.
Can attribution work without third-party cookies?
Yes. Approaches built on cookieless targeting, first-party data, and device or household-level signals are increasingly how cross-channel attribution holds together as cookies disappear from more of the open web.
How Arago helps
Arago reports impressions, clicks, CTR, viewable impressions, CPM and viewable CPM per line item, creative and ad size while the campaign is running, giving you a consistent, independent view of performance across every channel you activate through the DSP rather than a patchwork of platform-specific numbers.
Because every location runs as its own line item, down to a single store with its own budget and creative, you can see exactly which zones and ad sizes are pulling their weight without waiting for an end-of-campaign report. Set up your first line items in the DSP, or see our pricing to understand what you are actually paying for.