
A campaign wraps up and the export lands in your inbox: impressions, clicks, CTR, viewability, CPM, win rate, reach, frequency, a column for everything. Somewhere in that spreadsheet is an answer to the only question that matters, did this work, but finding it means knowing which numbers actually carry weight and which ones are just noise with a percentage sign on them.

A typical report buries a few decisive numbers inside dozens of descriptive ones.
Think in three layers, not one long list
The easiest way to make sense of programmatic metrics is to stop treating them as one flat list and instead sort them into three layers that depend on each other.
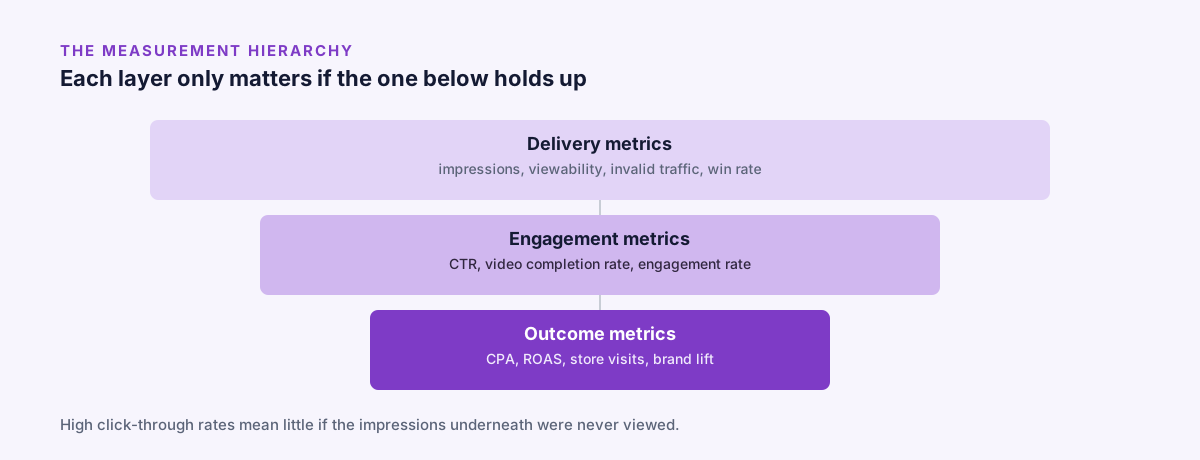
Each layer only matters if the one underneath holds up. A great click-through rate on impressions nobody saw is not a great number, it is a misleading one.
Delivery metrics answer whether the ads actually reached people in a meaningful way. Engagement metrics answer whether people responded. Outcome metrics answer whether any of it moved the business. Skip the bottom layer and the top layer becomes fiction.
Delivery: did it even have a chance to work
Impressions are the basic unit, one impression per ad served, and on their own they say almost nothing about quality.
Viewability is the first real filter. The MRC standard counts a display ad as viewable once 50% of its pixels are visible for one continuous second, two seconds for video. Viewability swings heavily by placement, device, and format.
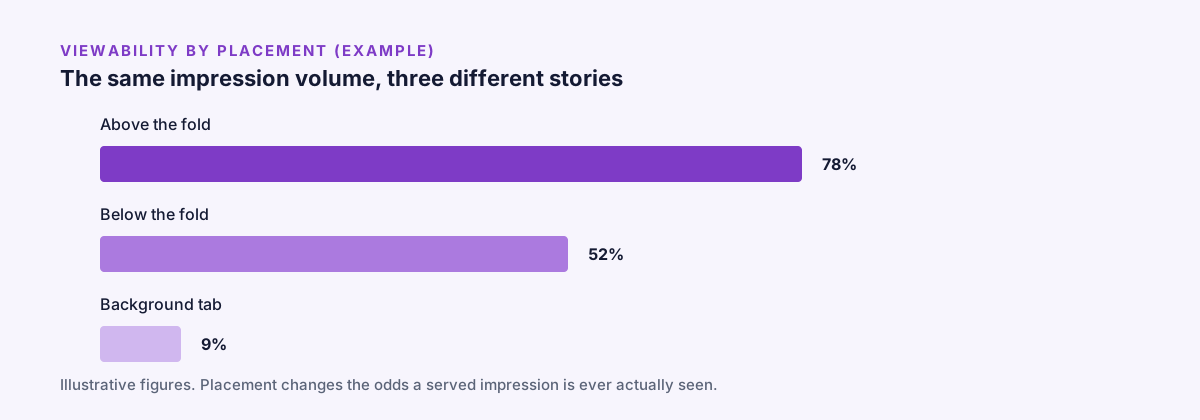
Illustrative numbers, but the shape is common: placement alone can separate a mostly-seen campaign from a mostly-wasted one.
Invalid traffic (IVT) covers bots, accidental activity, and other non-human noise, the same category behind most ad fraud. Reputable DSPs filter the obvious cases, but watching IVT rates, especially on a new supply source, catches what filtering missed.
Win rate tells you how many of the auctions you entered you actually won. A win rate that is unusually low can point to bids set too conservatively, floor prices higher than expected, or simply fierce competition for that inventory.
Reach and frequency split a campaign’s exposure into how many unique people saw it and how many times each one did on average. For a brand campaign, managing the second number carefully usually matters as much as growing the first.
Engagement: did anyone actually respond
Click-through rate (CTR) is the obvious one for performance campaigns, but it reads very differently by format. A display CTR that looks weak next to a search CTR is not a sign of failure, the two were never going to land in the same range.
Video completion rate (VCR) matters more than raw video impressions, since it tells you whether people watched or bailed early. Breaking completion into quartiles (25%, 50%, 75%, 100%) shows exactly where attention drops off.
Engagement rate, for rich media and interactive formats, captures what a click-based metric misses: expansions, plays, swipes, and other interactions specific to the format.
A click tells you someone’s thumb moved. An outcome tells you whether that movement was worth paying for.
Outcomes: did it move the business
Cost per acquisition (CPA) is the cost of one defined conversion, a sale, a form, an install, a store visit. For performance campaigns it is usually the most direct efficiency signal available.
Return on ad spend (ROAS) divides attributed revenue by spend. A ROAS of 4x means four times the cost came back in revenue, assuming the attribution behind it is solid, which is harder than it sounds once a customer touches more than one ad before converting.
Cost per visit and store visit attribution estimate physical foot traffic driven by exposure, often the primary goal for a retail advertiser. Methodologies differ across providers, so the number is a useful directional signal more than an exact count.
Brand lift studies compare exposed and unexposed audiences on recall, awareness, or purchase intent. They need a proper test design and enough sample size to mean anything, but they reach conclusions clicks cannot.

The most useful read of a report usually happens with two or three people arguing about what a number actually means.
The hard part: deciding who gets the credit
Figuring out which ad caused which outcome is one of the genuinely difficult problems in digital measurement. Last-click attribution, giving all the credit to the final click before a conversion, is simple to compute and routinely wrong, since it writes off every upper-funnel touchpoint that actually built the interest.
Multi-touch models spread credit across several interactions instead, and data-driven versions use statistics to estimate each one’s share. None of these models is exact, and two reasonable models can read the same data differently. The practical answer is to treat attribution as a directional guide, and to keep the methodology consistent over time rather than chasing the perfect model.
FAQ
What is a good viewability rate?
There is no single good number, since it depends heavily on format and placement, but a campaign consistently well below 50% deserves a look at where the inventory is coming from.
Should I worry if my CTR looks low?
Only relative to the right benchmark. Display CTR is naturally much lower than search CTR, so comparing across formats usually tells you less than comparing the same format over time.
What is the difference between reach and frequency?
Reach counts unique people exposed to a campaign, frequency counts how many times each of them saw it on average. A campaign can grow reach and shrink frequency, or the reverse, and the right balance depends on the objective.
Why do my ROAS numbers change when I switch attribution models?
Because different models assign credit to different touchpoints along the same path to conversion. The total revenue stays the same, but how much of it gets attributed to this particular campaign does not.
How Arago helps
Arago’s DSP reports impressions, clicks, CTR, viewable impressions, CPM, and viewable CPM, broken down per line item, creative, and ad size, while the campaign runs. Viewability is measured with the IAB Open Measurement SDK against the MRC standard, 50% of the ad visible for one continuous second, and you can add your own third-party tracking pixels per line item to check Arago’s numbers against your own ad server. That setup is covered in more detail in verifiable viewability and double tracking.